Benchmarks: measure your event performance against competitors
As part of our recently announced Insights, we unveiled a feature that delivers a first for the ticketing industry: Benchmarks.
Based on business intelligence tools available in other industries - but lacking in the world of events - this feature will allow you to measure key metrics about your events to comparable organisers and industry averages.
Read on for more information about how it works, and how it could help you to maximise the success of your events in the long term.
What is benchmarking?
Benchmarking is a process where a business or organisation compares its performance to leading competitors or industry standards to identify areas for improvement.
It involves gathering data on various metrics - such as efficiency, cost or consumer behaviour - and using this information to set goals and implement best practices.
The aim is to understand how others achieve their results, identify opportunities for improvement, and apply similar strategies to enhance your own performance.
How do we collate the data?
We have thousands of event organisers using our platform across the UK and beyond, spanning nightlife, attractions, entertainment, sports, education, food and drink, performing arts, festivals and more.
That means we are able to create a picture of what the 'typical' event organiser looks like in a given category.
By aggregating data from across the industry - which is anonymised to ensure no identifiable or traceable information about specific clients is shared - we can provide averages to benchmark against for different areas of the event industry.
How is the data presented?
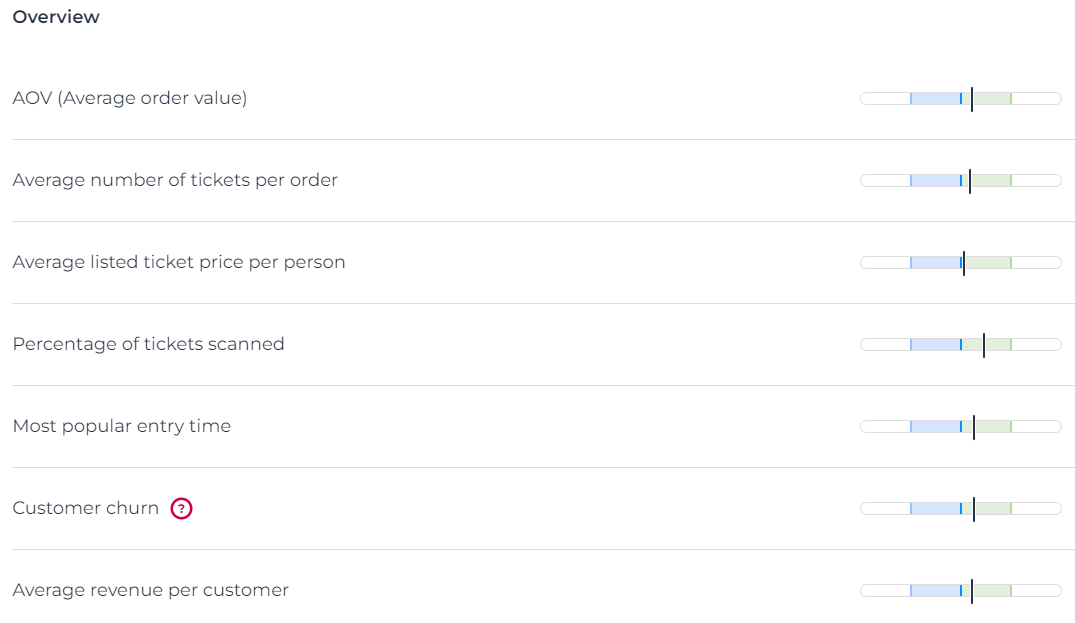
An 'Overview' section provides topline figures for your key metrics within the selected date range - including average order value, most popular entry time, average ticket price and customer churn - and how they compare to the industry averages. Each of these is compared to the lower, median and upper averages.

In the simplest terms: the closer you are to the middle line, the closer you are to the average. If you're on the lower line, only 25% of similar event organisers have a lower value. If you're on the upper line, only 25% have a higher value.
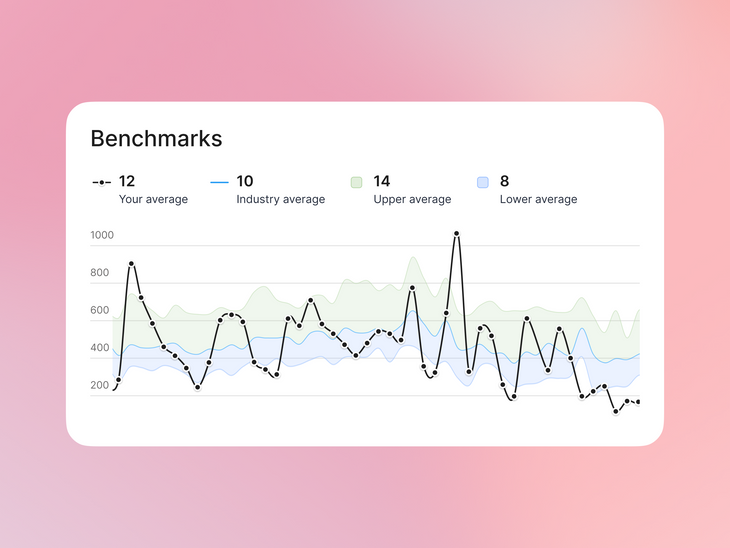
This is followed by more in-depth visualisations of these key metrics, exploring the data and benchmarking day-by-day to give you a fuller picture of how your event performance compares to similar event organisers over the same period.
How can it help event organisers?
While information about your audience demographics, sales and revenue is incredibly helpful in getting a better understanding of your events, Benchmarks takes things one step further.
By clearly contextualizing how your events shape up compared to competitors, you can massively reduce guesswork and finetune your offering to maximise success.
For example:
Pricing
Could you boost revenues by increasing your ticket prices in line with similar event organisers? Or could you sell a greater volume of tickets by reducing the price?
You can also see how the averages change by day of the week, helping you identify how your ticket prices could differ depending on when the event is taking place.
Likewise, explore the effect that calendar milestones - bank holidays, paydays, Halloween or New Year's Eve - have on average ticket prices and expectations around customer spending to help you adjust accordingly.
Customer retention
In tandem with the Customers section of Insights (watch this space for more detailed information), you can measure your customer churn and assess whether you are losing customers at a higher or lower rate than other event organisers.
If it's lower, is this a reflection of the work you are doing to build loyalty and garner repeat bookings? If it's higher, what actions could you take in terms of remarketing to retain customers who have previously attended your events?
After all, retaining customers can cost as much as five times less than acquiring new ones!
Audience behaviour
Are your attendees coming to your events later than average? If so, are there ways you could encourage or incentivise earlier arrivals to get people through the door, reduce queues or improve audience flow? For example, offering cheaper tickets for arrival before a certain time, in-venue discounts or freebies for early arrivers.
You can also compare your no-show rates by seeing the percentage of tickets scanned for your events. This enables you to measure the proportion of your ticket buyers that attend your events on average, assess how that compares to competitors, and take steps to boost attendance if needed.
Already using FIXR for your events? Head here to explore Insights.
If you want to learn more about how Insights can help you make informed decisions about your events, get in touch below.
Author
