Five things you should expect from your ticketing platform's analytics
As we've already explored, ticketing and events management platforms are uniquely positioned to provide genuine insights into the inner workings of an event organiser's business.
But at a time when event organisers need to minimise guesswork, reduce risk and find ways to retain and grow their audience, too many ticketing platforms are failing to provide them with the tools for success.
Across other industries, analytics and business intelligence tools are commonplace, transforming data into useful information for business success and growth. So why not expect the same in the events industry?
Here's what you should expect from the analytics and insights that your ticketing platform provides.
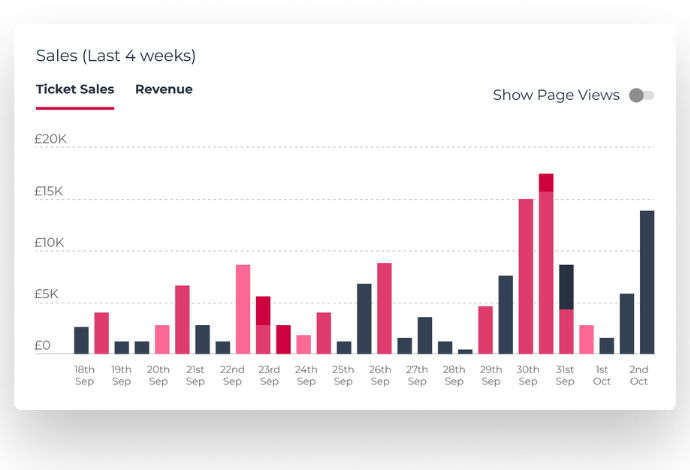
Data visualisation
Translating information into a clear visual context - whether a chart, graph or table - makes data much easier to understand and draw insights from. It means you can more easily recognise patterns, spot outliers, make predictions or identify areas for improvement.
It makes the data more accessible so that anyone can absorb what the information is telling you, and offers a more compelling narrative about the performance of your events than numbers on a page.
Sophistication
In addition to focusing on how it is presented, you should expect practical detail in the data you see. Analysis should go beyond the simple topline figures like 'total sales' or 'total revenue' to offer information you can use to grow your business. This could include:
- Your top customers and who to target for re-engagement.
- The average age of your attendees, with comparisons between events.
- Trends in when people book tickets across your events.
- How your average ticket price compares to other similar events in your region.
Clarity and context
While there must be a sufficient level of detail and sophistication in what you are being told/shown, it's equally important that you're able to readily interpret data and draw conclusions from the information presented to you. Why is the information relevant, useful and potentially beneficial to your business?
Real-time analytics
You don't want to download a static .csv file each time you want to access relevant data, or only see analytics reflecting a fixed time period. Having access to constantly evolving, real-time data analysis means you can stay engaged throughout every stage of your events' lifecycles, using the insights as part of a continual process rather than just referring to them after an event has passed (when the potential to act on the insights has a much lesser impact).
Customisability
If you're using data and analytics to drill down into the details of your events and business, you should be able to customise what you see. You want to be able to compare performances between events and date ranges of your choosing; so that you can get a fuller picture and identify trends that inform decisions on your future strategy based on what has worked best in the past.
The power should be in your hands not only to access your data, but to use it in a way that works best for you. Too often, ticketing platforms guard your audience data (using it for their own benefit) or fail to present it in a way that offers true value to your events business. This doesn't have to be the case.
If you want to learn more about how FIXR's analytics could help you grow your events business, don't hesitate to get in touch. We'd love to hear from you!
Author
